BMO’s New Target Cash Flow ETFs (.T Units): Sustainable Income or Yield Trap?
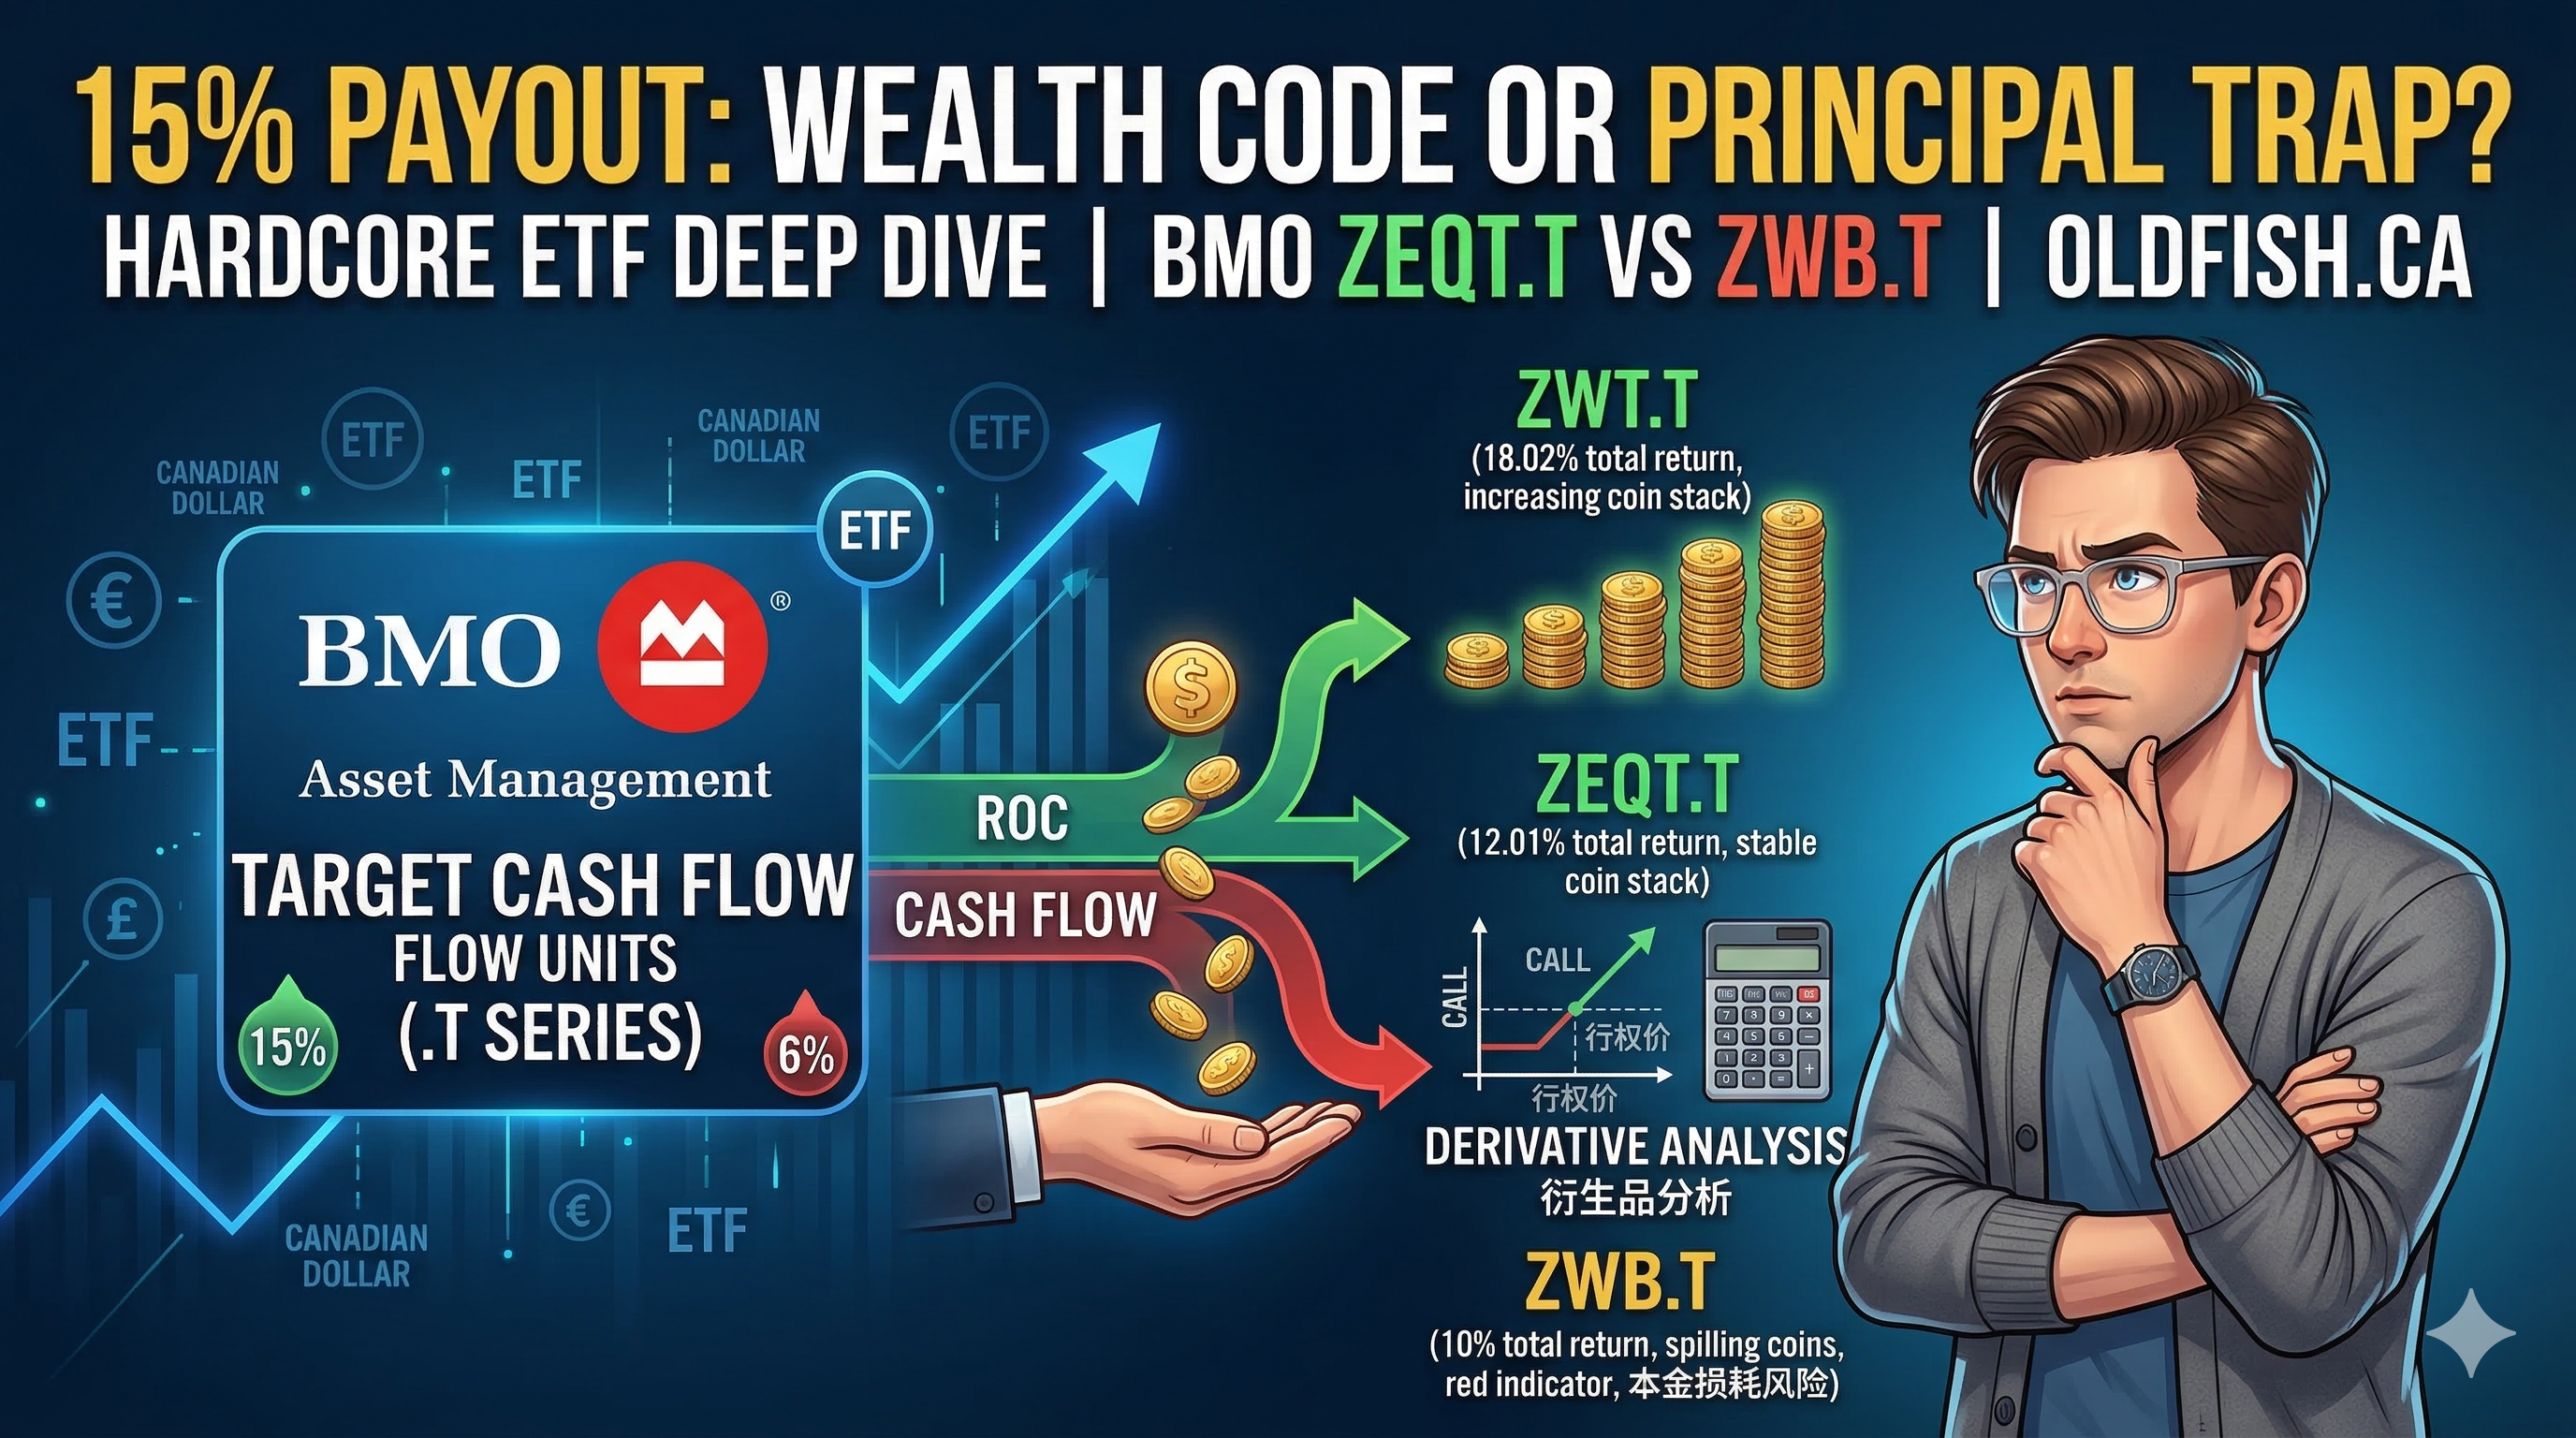
BMO’s New Target Cash Flow ETFs (.T Units): Sustainable Income or Yield Trap?
If you’ve been following the Canadian high-dividend ETF space, you’ve likely noticed BMO’s latest major move: the launch of their Target Cash Flow units (the new .T series).
This is a significant shift in how we think about "yield." While we usually talk about Covered Call ETFs, these .T units operate on a fundamentally different logic. Today, we’re going to break down the mechanics, the math, and whether these are a "buy" for your portfolio.
The Mechanism: ROC vs. Covered Call Premiums
A standard Covered Call ETF generates distributions by selling options and collecting premiums. BMO’s Target Cash Flow series, however, relies on Return of Capital (ROC) to meet a specific payout goal.
There are two main scenarios for these units:
- Underlying Covered Call ETFs (e.g., ZWEN.T, ZWK.T): These assets already have respectable yields. However, the .T units set a distribution target higher than the original yield. Any shortfall is made up by returning a portion of your principal.
- Underlying Total Market ETFs (e.g., ZEQT.T, ZGRO.T, ZBAL.T): These assets typically have low internal yields (1%–3%). Since the .T versions target a 6% payout, the gap is filled entirely by returning capital.
The Core Analysis: Is ROC Always a "Bad" Thing?
The big question is: can your Net Asset Value (NAV) grow while you’re receiving these payouts? The answer lies in the math of Total Return.
The Cautionary Tale: ZWB.T
Take ZWB (BMO Canadian High Dividend Covered Call ETF), the parent of ZWB.T. It has a 15-year track record and a yield of 5.68%.
- ZWB.T Target Payout: 13%
- Historical Total Return (Reinvested): ~10% per year.
The Math: If you take out 13% in cash flow from an asset growing at 10%, your principal will inevitably erode. In this case, the distribution is "eating" the house.
Finding the Winners: Growth vs. Payout
I’ve crunched the numbers, and several products in BMO’s new lineup actually have growth that outpaces their target payout:
| ETF Ticker | Strategy | Target Payout | Historical Total Return (Approx.) | Verdict |
|---|---|---|---|---|
| ZWT.T | Tech Covered Call | 11% | 18.02% | Sustainable |
| ZEQT.T | All-Equity | 6% | 12.01% | Sustainable |
| ZGRO.T | 80/20 Equity/Bond | 6% | 9.67% | Sustainable |
| ZWEN.T | Energy Covered Call | 13% | 14.20% | Sustainable |
ZWT.T stands out. Because BMO’s tech strategy only covers up to 50% of the portfolio and writes Out-of-the-Money (OTM) calls (sometimes 10% out), there is significant "upside" left for the NAV to climb even after paying out 11%.
Deep Dive: The Essence of Cash Flow
Why choose a "principal return" unit like ZEQT.T over a leveraged Covered Call ETF?
In a bull market, a mechanism that avoids capping your upside with calls—and simply returns principal instead—is actually more efficient. It sounds counter-intuitive, but we have to ask ourselves: Do we want the "Covered Call strategy," or do we just want the "Cash Flow"? With the .T units, cash flow is no longer exclusive to Covered Call strategies. You get 100% of the market's upside minus your "active withdrawal."
Risk and Defensive Analysis: Does Leverage Protect You?
When prices drop, we expect option premiums to provide a buffer. But when you add 25% leverage into the mix, that protection often evaporates.
-
Scenario 1: Sideways/Slow Decline. Here, Covered Calls win. Premiums from small bounces offset the stagnation.
-
Scenario 2: The Crash (The Bitcoin Example). Over the last 6 months, Bitcoin dropped 40%. The spot ETF (IBIT) dropped 39.38%. However, the 25% leveraged versions (HBIX, BCCL) dropped 42%–44% even after distributions.
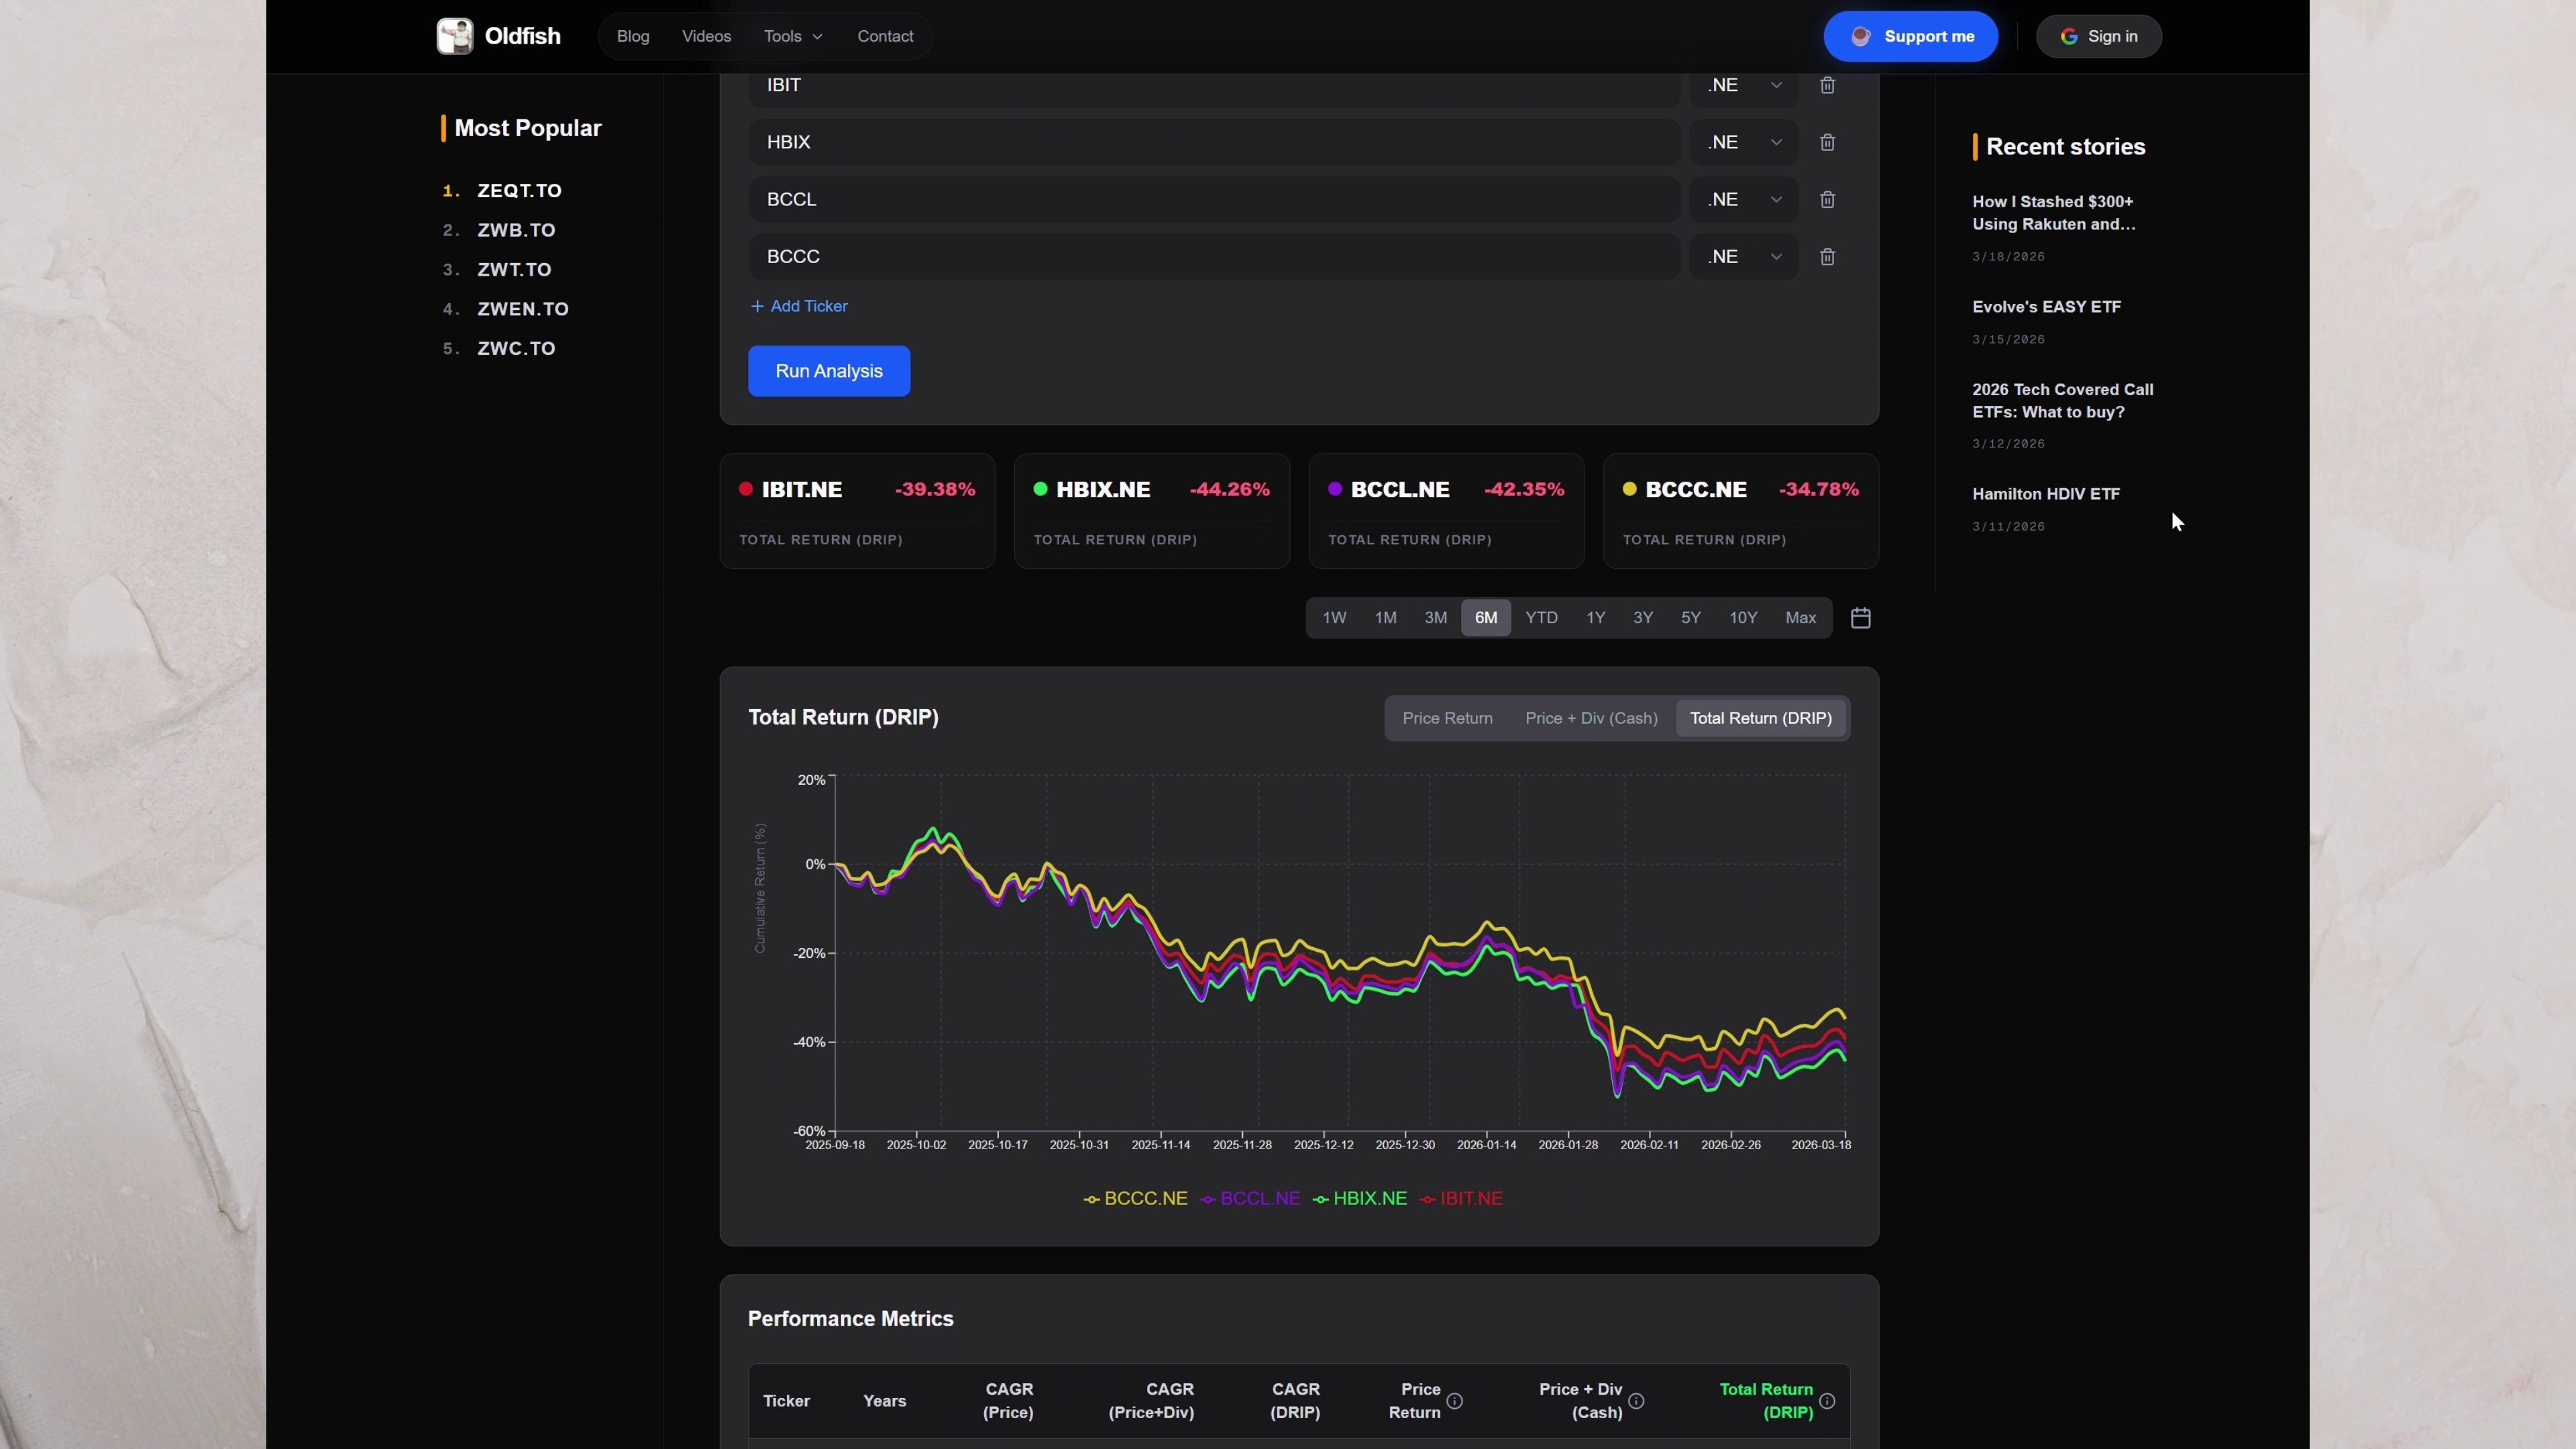
Key Takeaway: During a crash, option premiums are rarely enough to offset the damage done by 25% leverage. The non-leveraged BCCC actually performed best, dropping only 34.78%.
Closing Thoughts: Consistency vs. Growth
One final observation: Covered Call ETFs still win on distribution consistency.
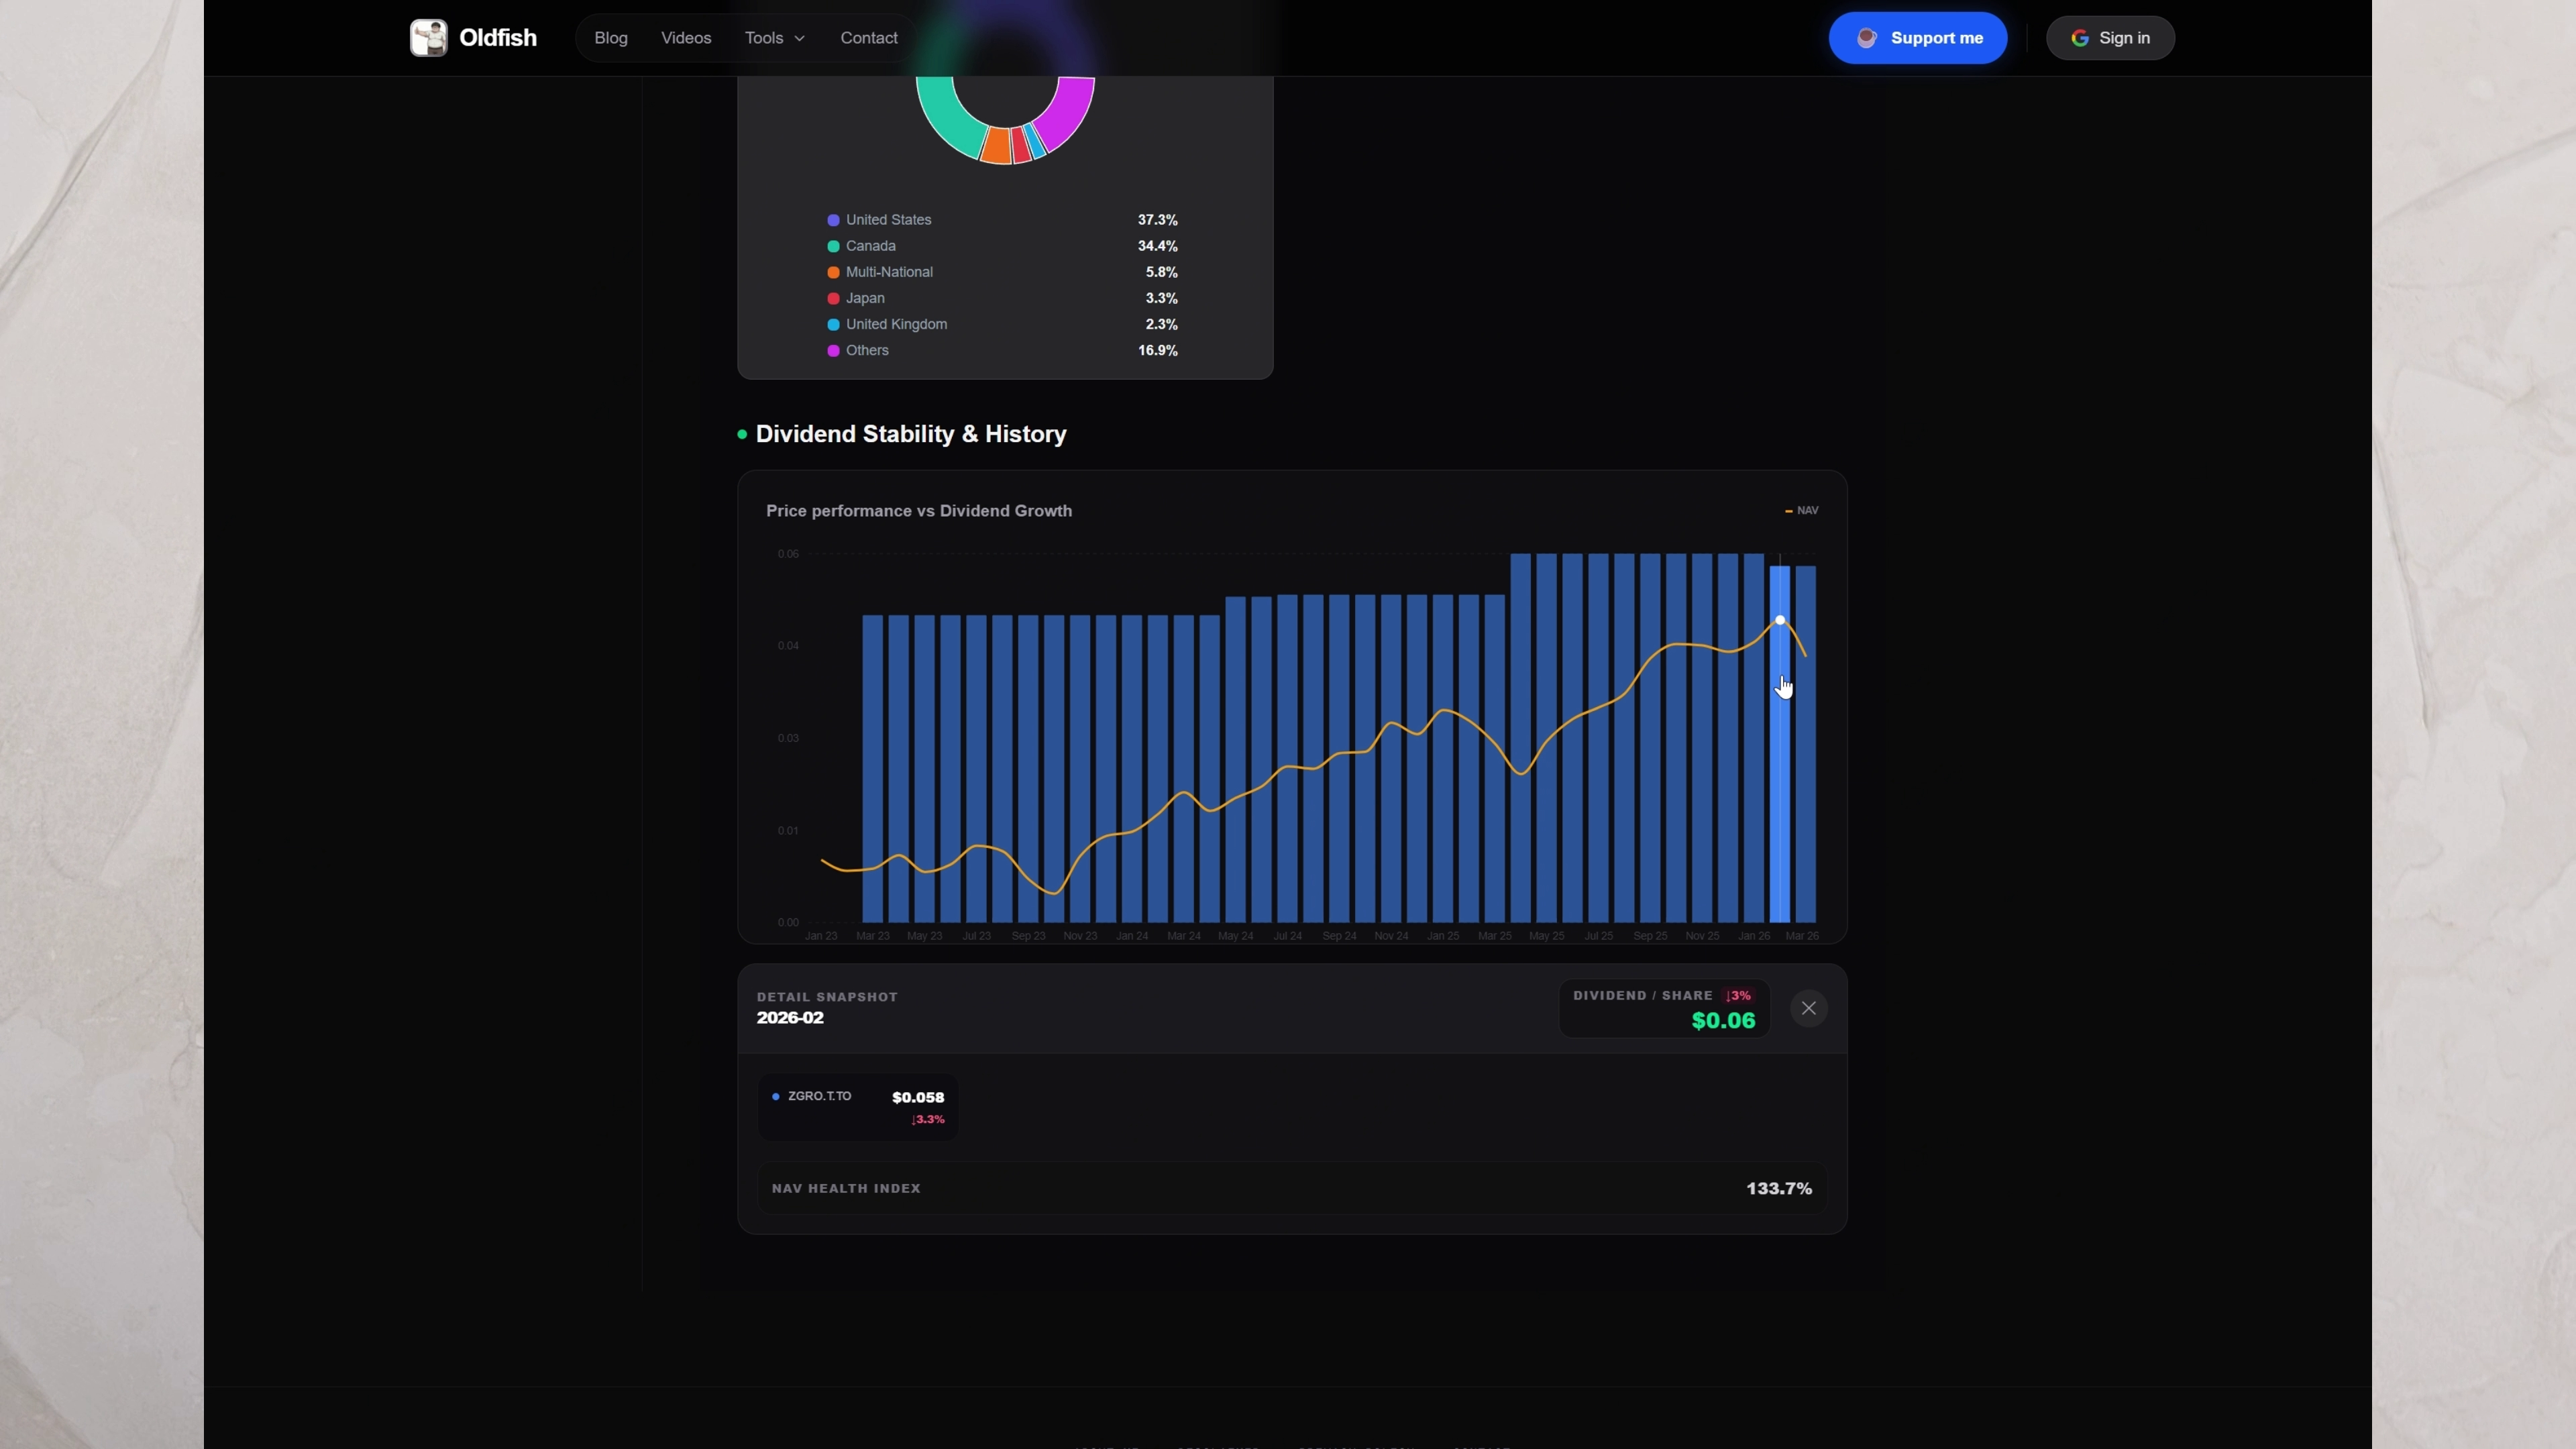
Compare BMAX to ZGRO.T. Despite having 33% leverage, BMAX has never cut its dividend. Meanwhile, ZGRO.T recently cut its distribution by 3%, even though its NAV is higher than last year. BMO’s logic for these adjustments remains a bit of a "black box."
So, which would you prefer?
- The "bird in the hand" with option premiums?
- Or ZEQT.T, with a 6% yield that lets you keep 100% of the market's upside?
Disclaimer: This post is for informational purposes only and does not constitute financial advice. Investing involves risk. Always do your own due diligence.